
Merchandise Plan
Video Trainings:
Merch Plan Overview: https://youtu.be/cPQ1YtDWn4Q
Merch Plan Sales Video Calculations: https://youtu.be/ac8lCUPC5h8
Merch Plan Inventory Video Calculations: https://youtu.be/9kJq-bPwqog
Merch Plan Inflow Video Calculations: https://youtu.be/cBqQAanGGwY
Purpose of report:
A working document to diagnose and strategize with the data. Answer the following questions:
Where was performance historically?
Where is performance currently (Last Month)?
What is the plan going forward?
Relevant changes made recently to the report:
Consolidation of sales/markdowns/inflow/inventory in the Year-over-Year box. It should be easier to see those relationships in view of year over year trends. Are they a cause for concern, or present further opportunity?
-
- How much sales did I do last year, compared to this year, and how is the plan shaping up in reflection to that trend?
- What was driving the business YTD last year vs YTD this year? Was it markdowns? Was it more fresh inflow?
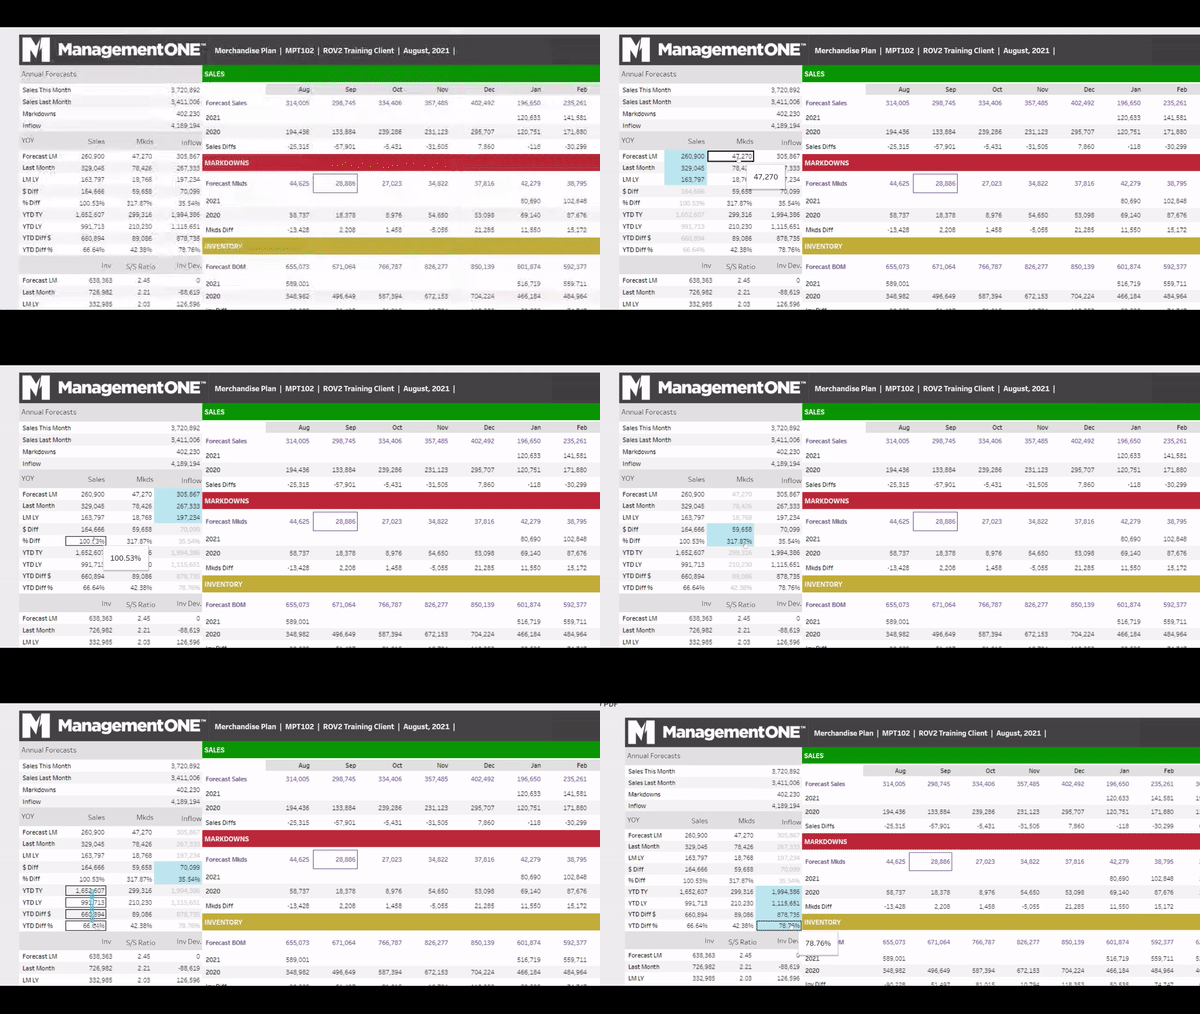
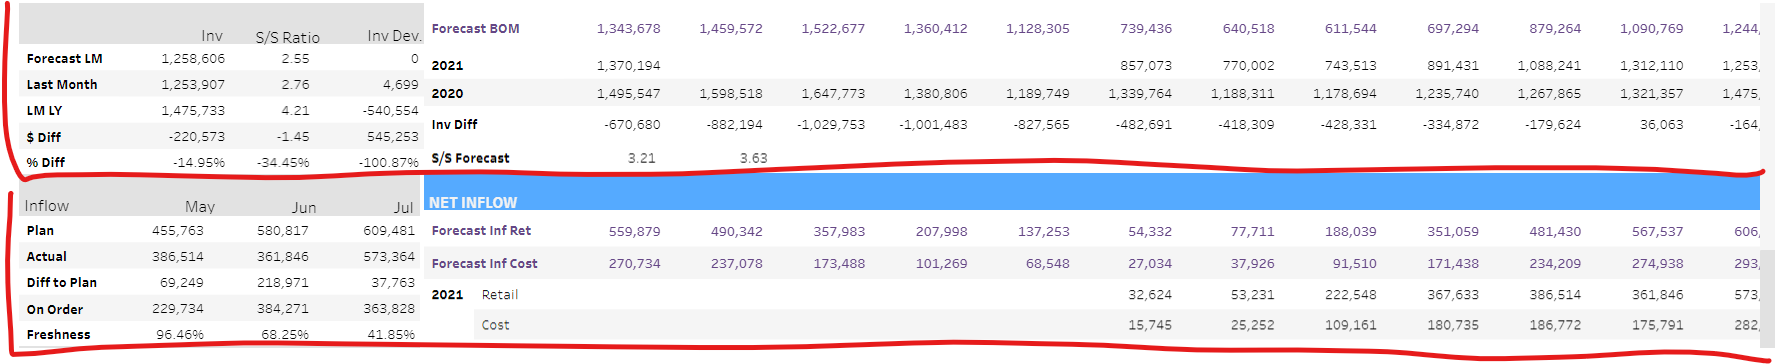
- Year-over-Year Inventory position follows in the box below, to the left of the forecast inventory section. Here you can view inventory at retail, S/S ratio, and Inventory Deviation.
- Continuing down on the left-sidebar, you have the actual inflow vs plan (plus On Order) over the last 3 months; which is also conveniently to the left of the forecast net inflow section.
-
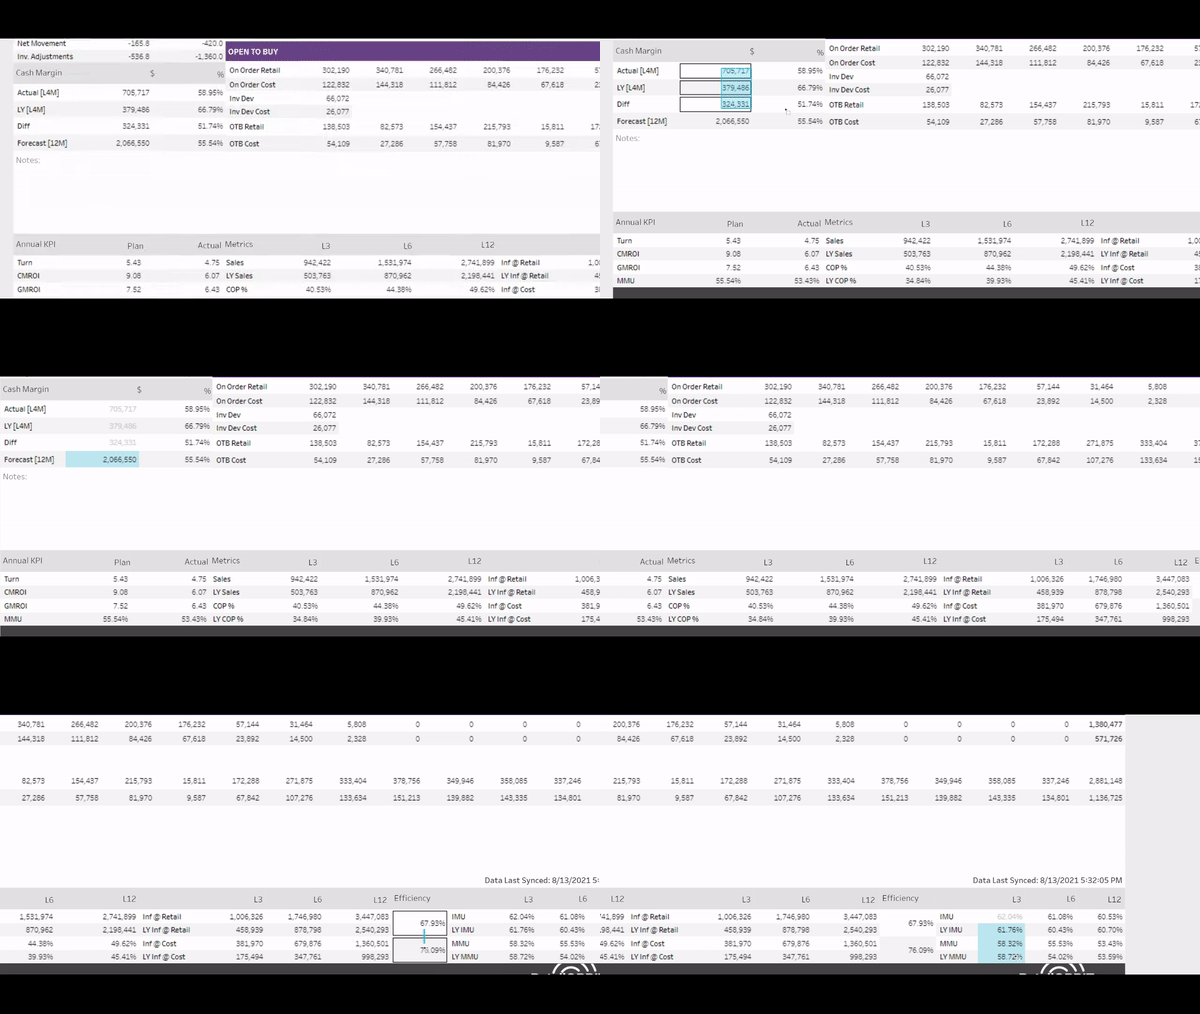
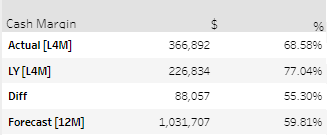
Expanding the Year-over-Year Comparisons into the Cash Margin and Inflow Metrics section...
- How much cash was generated in this class last year compared to this year -- bottom line?
- How have the Cost of Purchases trended this year compared to last year
- Has my efficiency improved?
- How have margins trended this year compared to last year
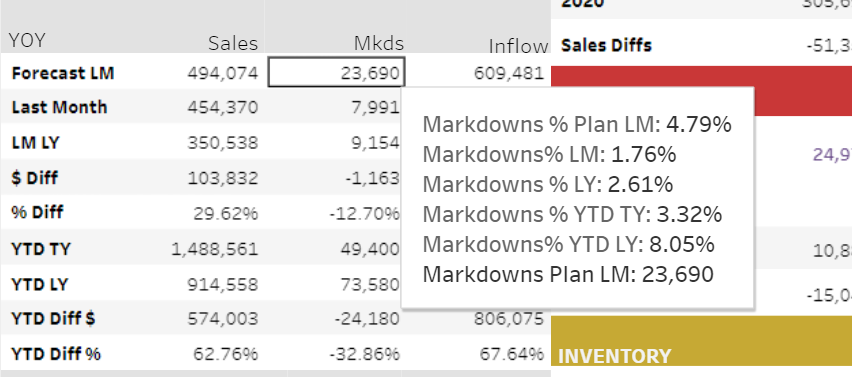
- Markdown % is viewed by mousing over the markdown dollars. See the % for all comparisons.
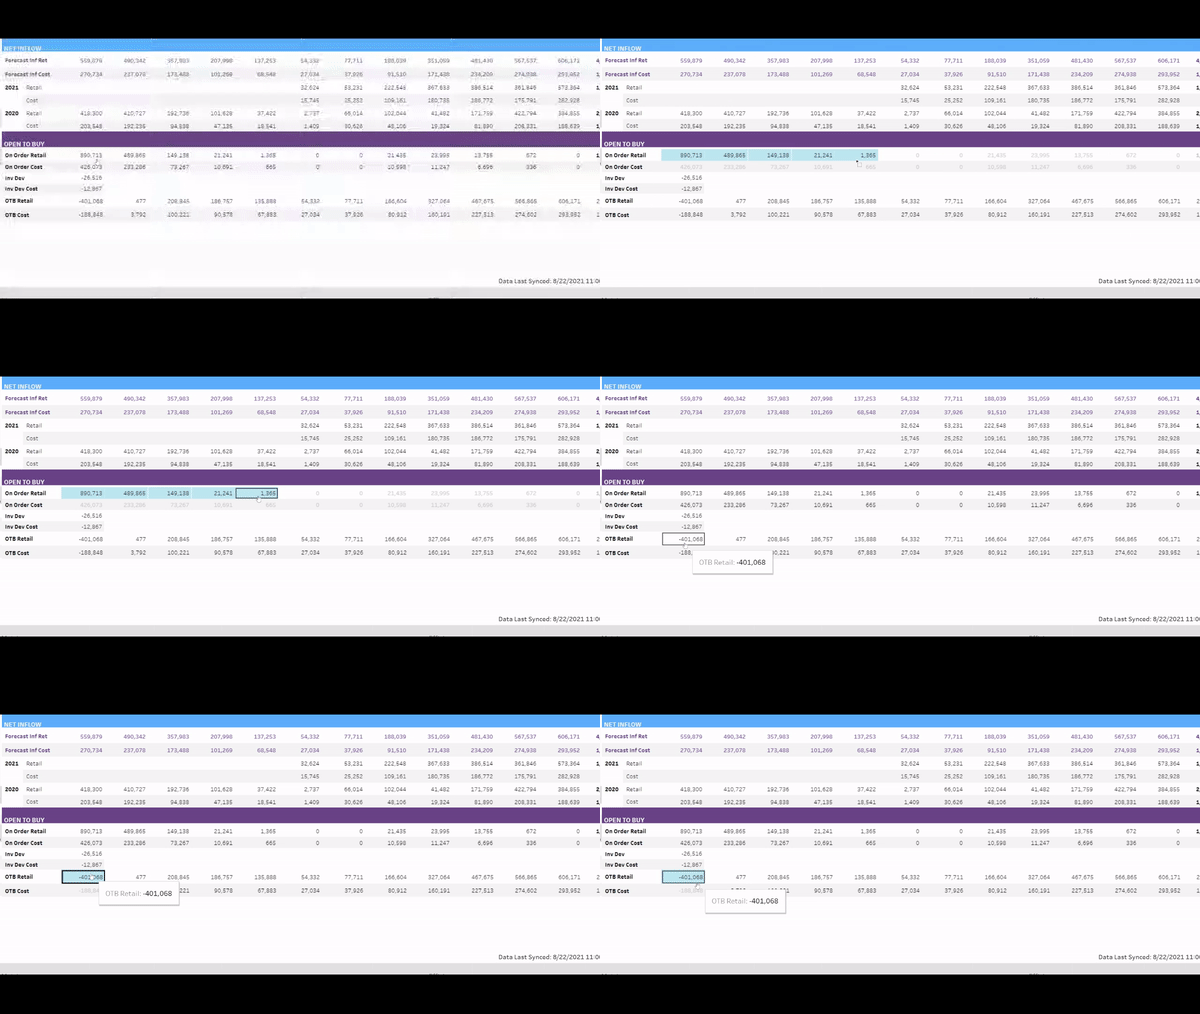
- You can summarize any range of months for any row in the OTB section by clicking and dragging your cursor.
- Switched order of years and forecasts in the body of the report. Forecast is the headliner.
From this...

To this...

What’s missing or dramatically changed:
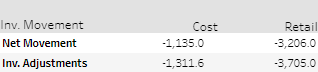
- Inventory Movement - is now a net inventory value. We decided that the components of this are important to track in the inventory variance report, which is now spannable. See updates to inventory variance report.
From this...
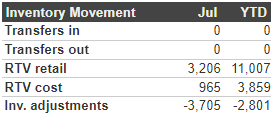
To this...
- Removed plan visual and added more comparison analysis about Cash Margin. The intent is to keep the client focused on the Year over Year Comparison (particularly over the last season), and then plan going forward. Here it shows the impact on the bottom line - Cash!
From this...
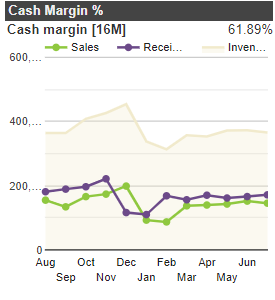
To this...
-
Removing the last month column enables a cleaner design for displaying forecast and summary data.
- Last Month and YTD comparison information belongs in the Year-over-Year box, and now forecast comparisons are purely forward-looking.
- It presents a cleaner view of the summary column. Previously, the 12th month forecast column was blended with the summary data column, but they are now distinct
- Removal of the Forecast Summary Section which duplicates existing forecast lines, we maintain focus on comparisons: plan vs actual vs last year, and allow for notes section. Furthermore, summary infow and OTB can now be found on the new OTB Recap report.
Comments
0 comments
Please sign in to leave a comment.