
Inventory Performance
Training Video:https://youtu.be/KU2Y_HlBYm4
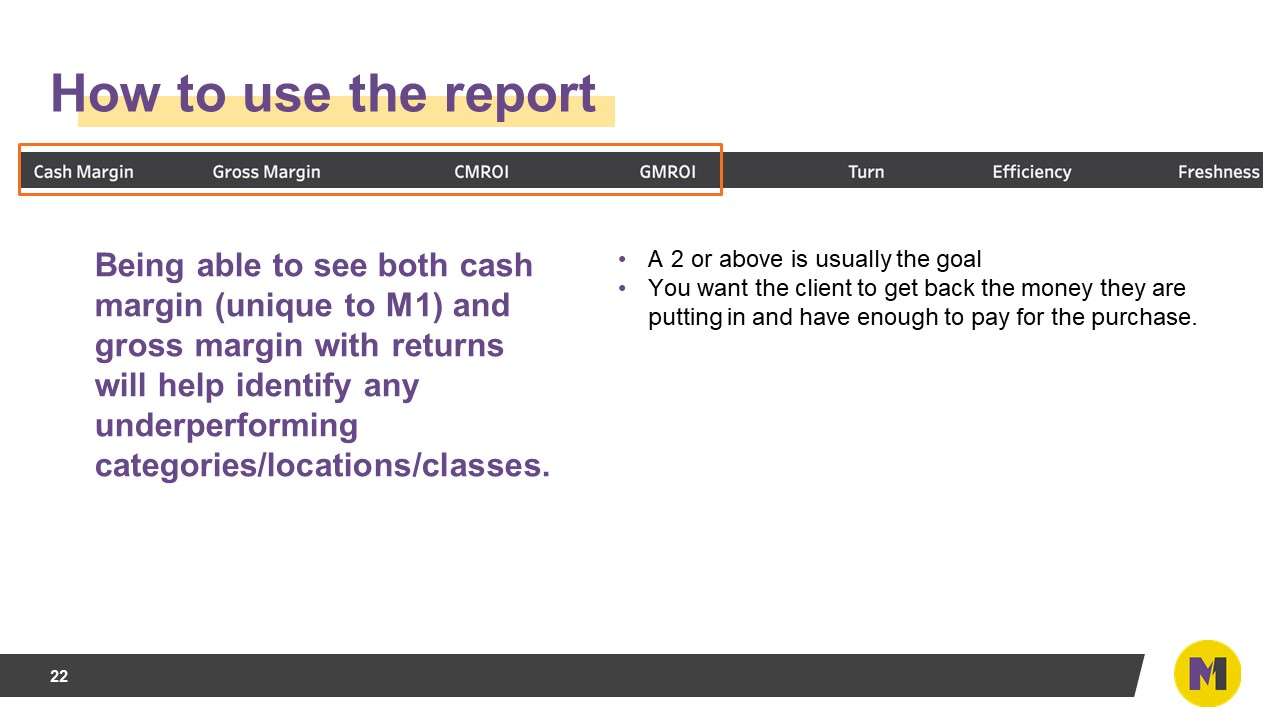
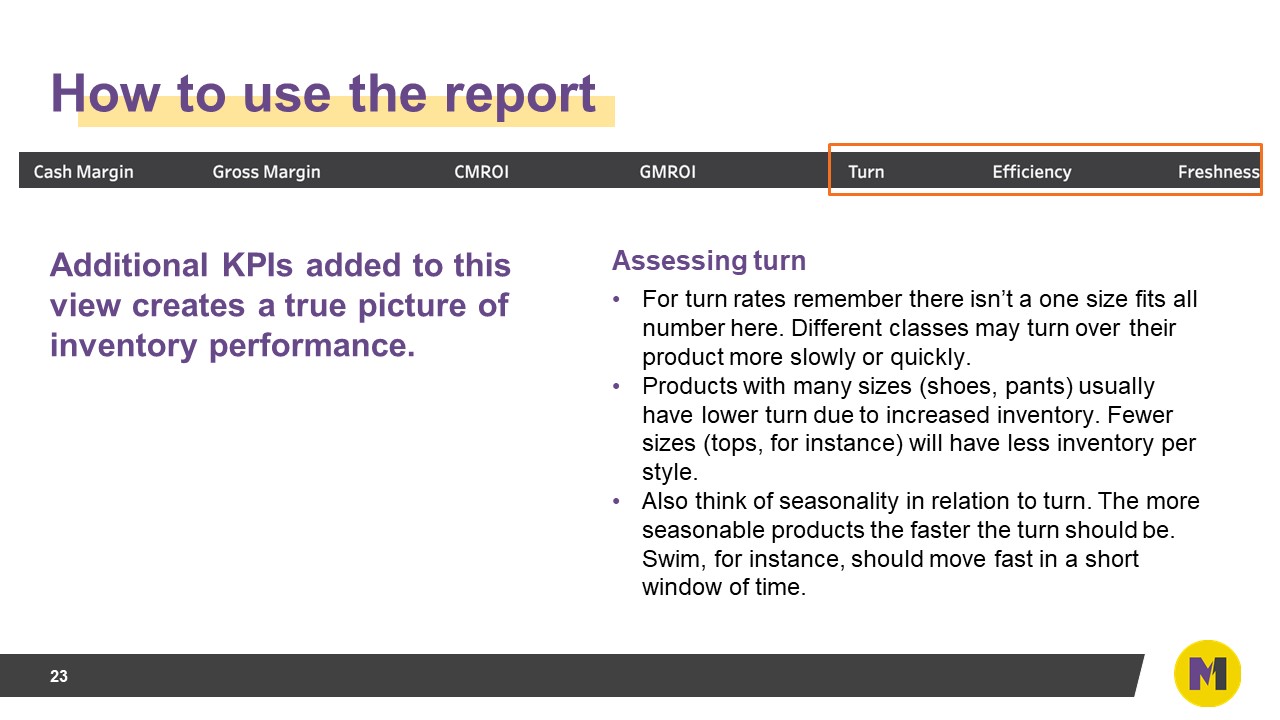
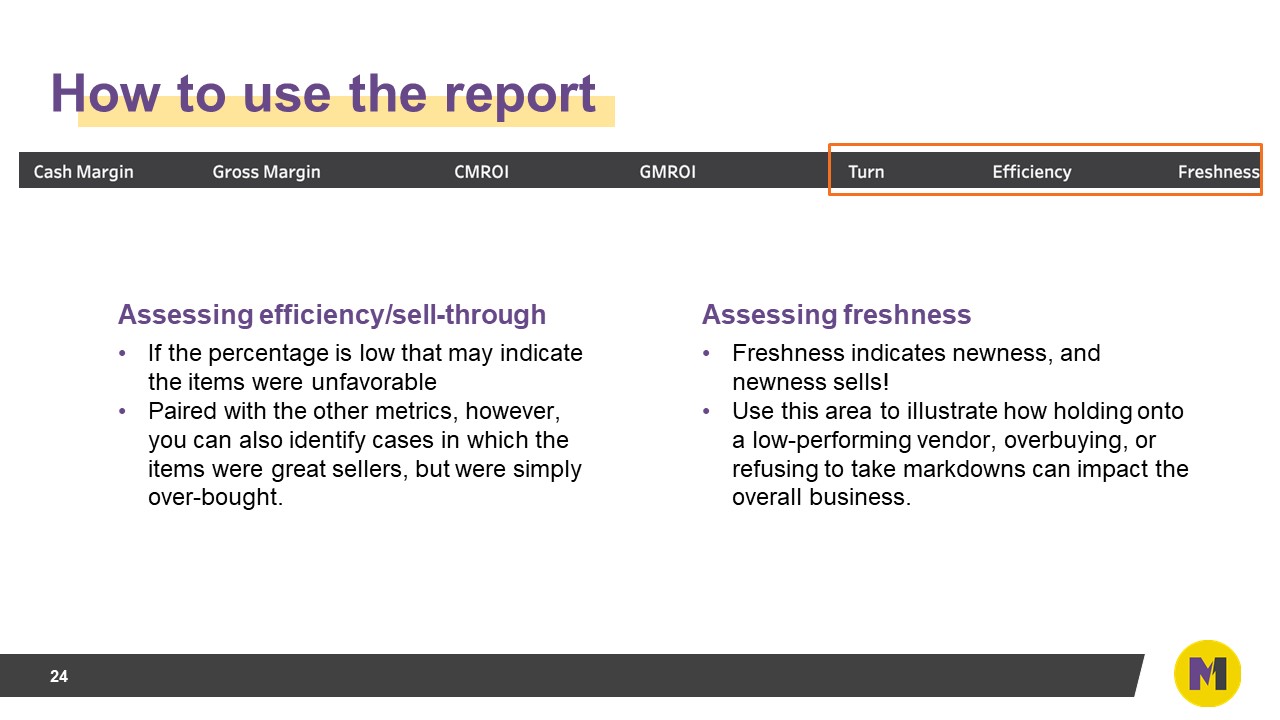
Relevant changes made recently:
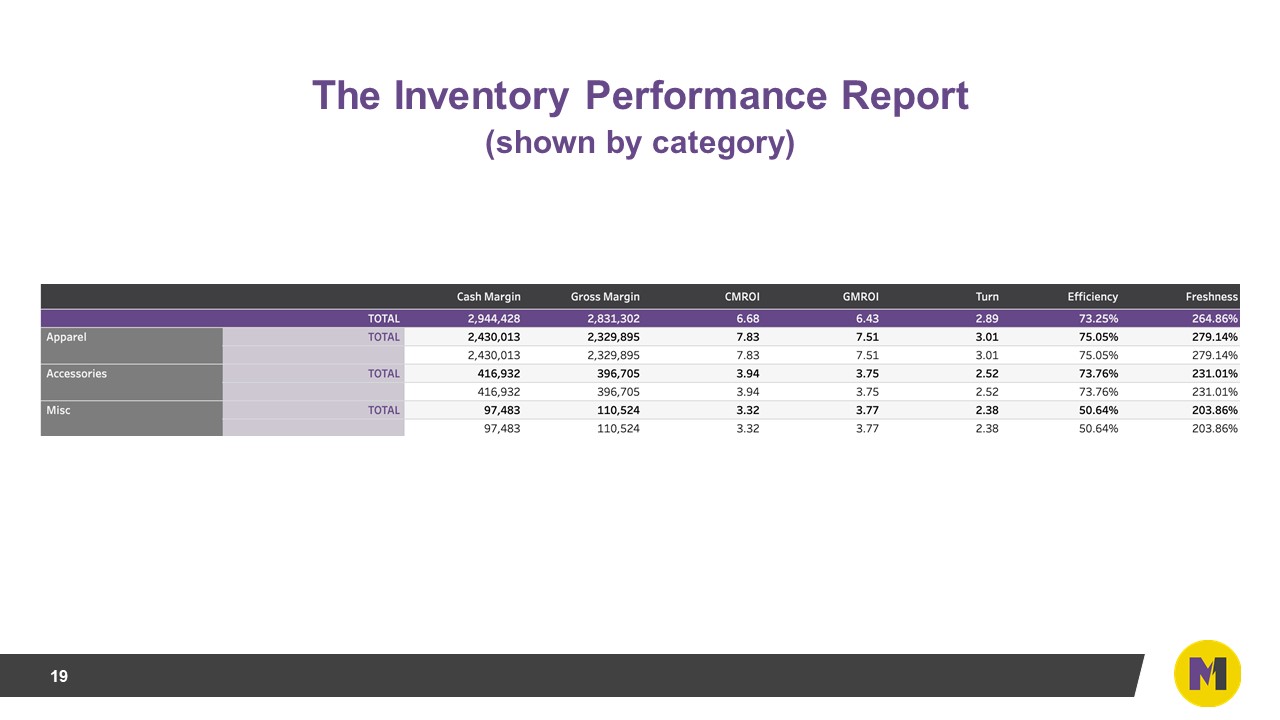
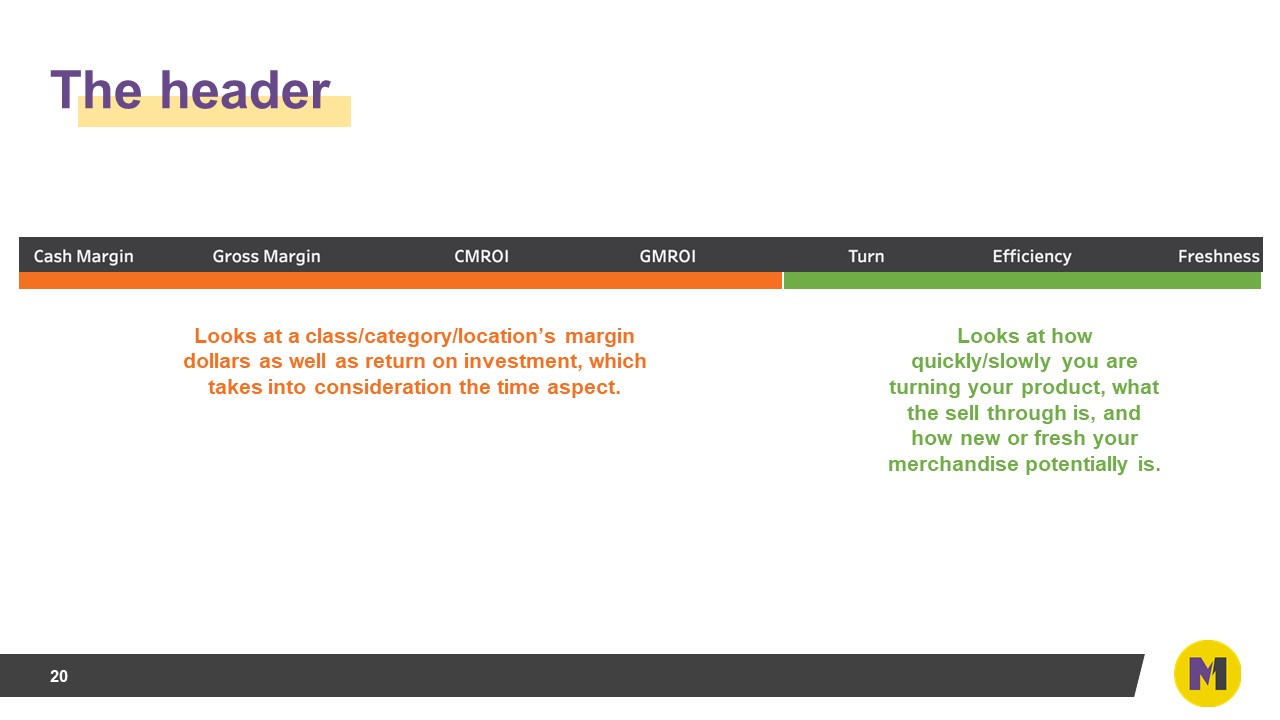
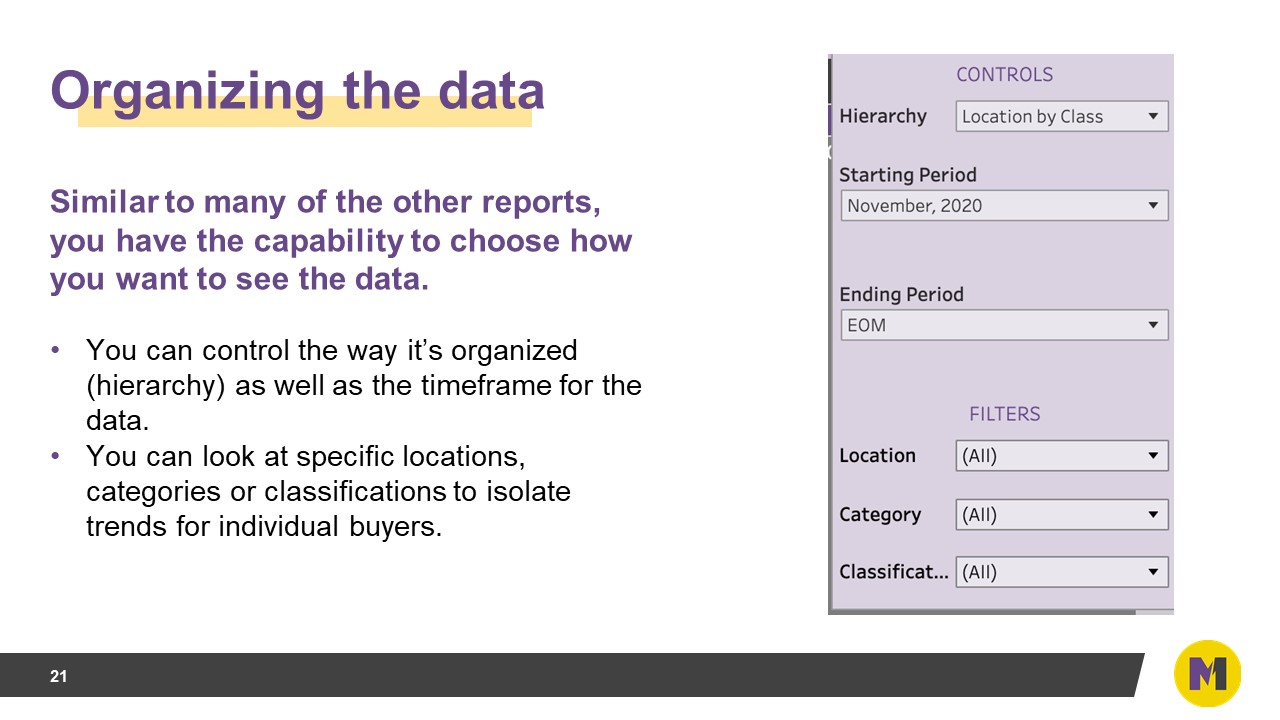
Inspecting any of these metrics, you can organize them better with new interactive features that enable you to sort and trend any of the inventory performance metrics.
Span: This creates more flexibility to view margin and efficiency over different time periods. You can see cash margin, efficiency and turn for the last 3 month period, for example. What’s good here is that all of the metrics on this report will update based on a change to span.
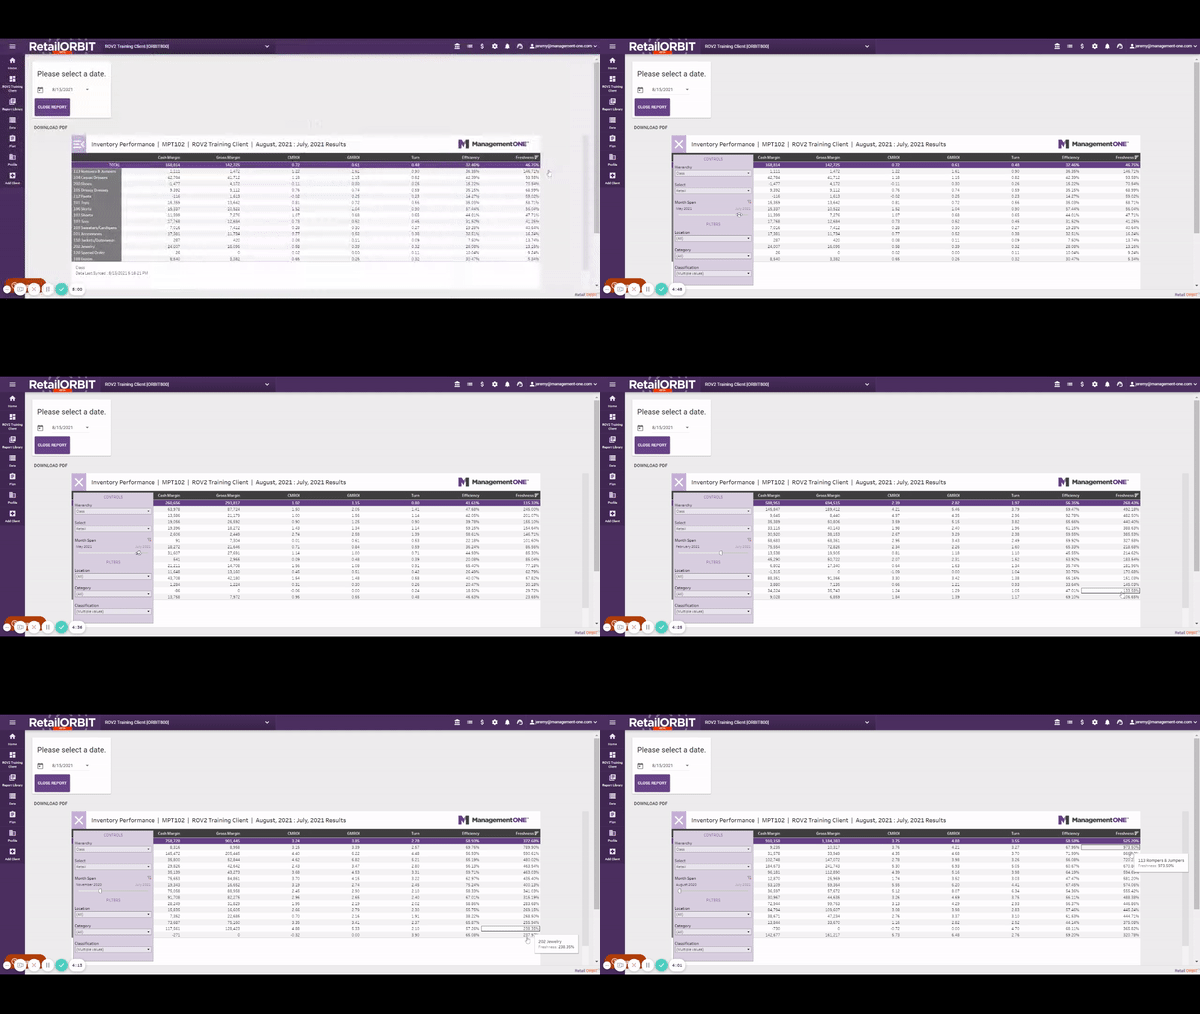
In this example, you can sort classes by most efficient to least efficient, and then see how that ranking changes between a 12-month trend and a 3-month trend after adjusting the span.
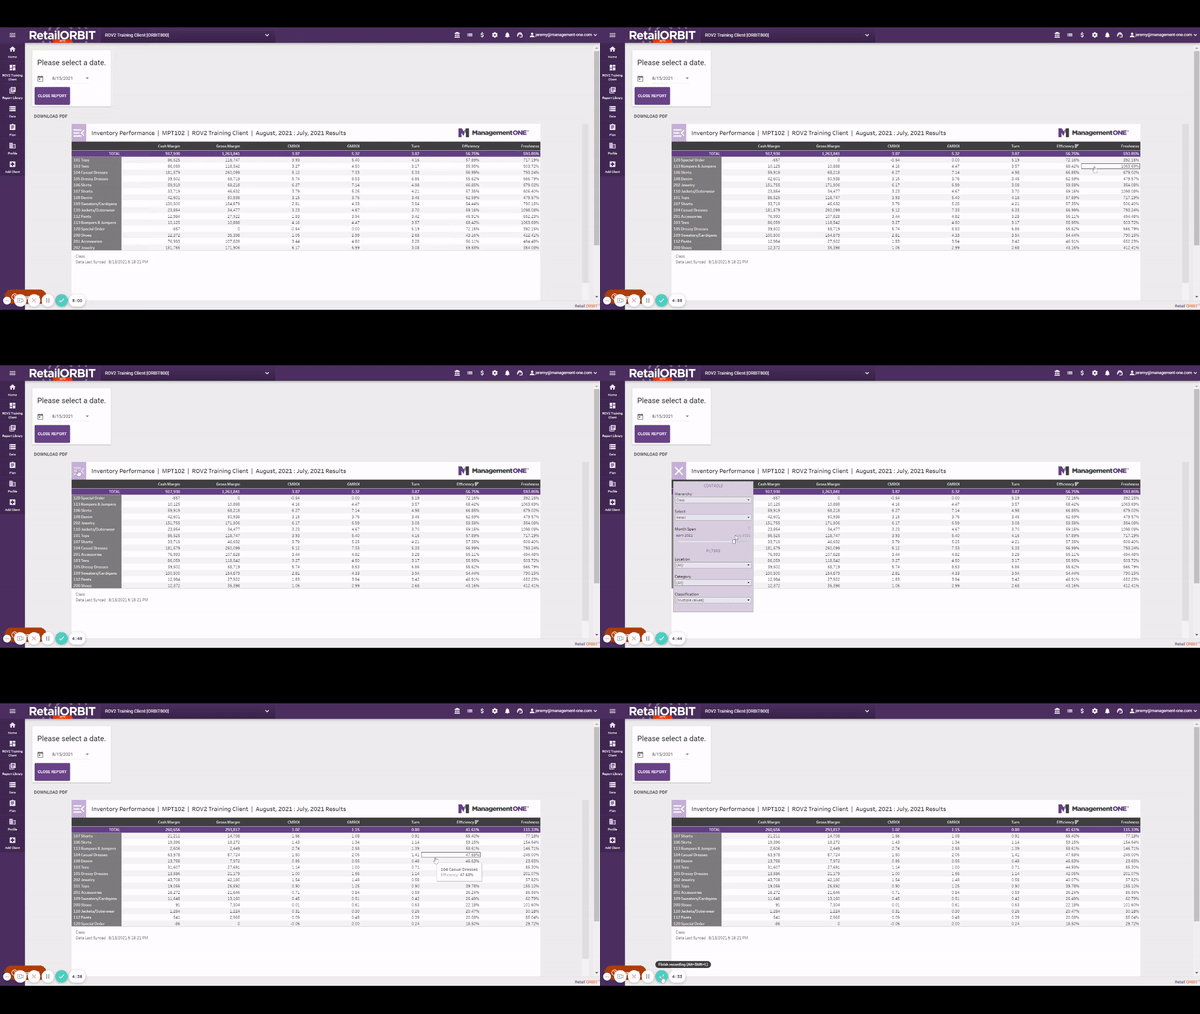
Freshness: This has only ever been viewed in the plan and as a benchmark over time periods of 30,60,90 days. Note that a default view of 12 months, or any time period greater than the last 3 months will most likely always show freshness above 100%, or in some cases much greater. This will present an unusual view at first, but could be useful to see if a class front-loaded a lot of merchandise 4 months ago, for example.
Here is how you can use span to update the freshness metric on the inventory performance. Let’s rank the classes by freshness, and then use span to update the freshness metric by a length interval of every 3 months starting at 30 days and ending with 12 months. Essentially, what classes are the freshest over 1 month, 3 months, 6 months, 9 months 12 months?
Comments
0 comments
Please sign in to leave a comment.