
The Class Performance Report
Training Videos: https://youtu.be/Yp4KJvGRuMI
Relevant changes made recently:
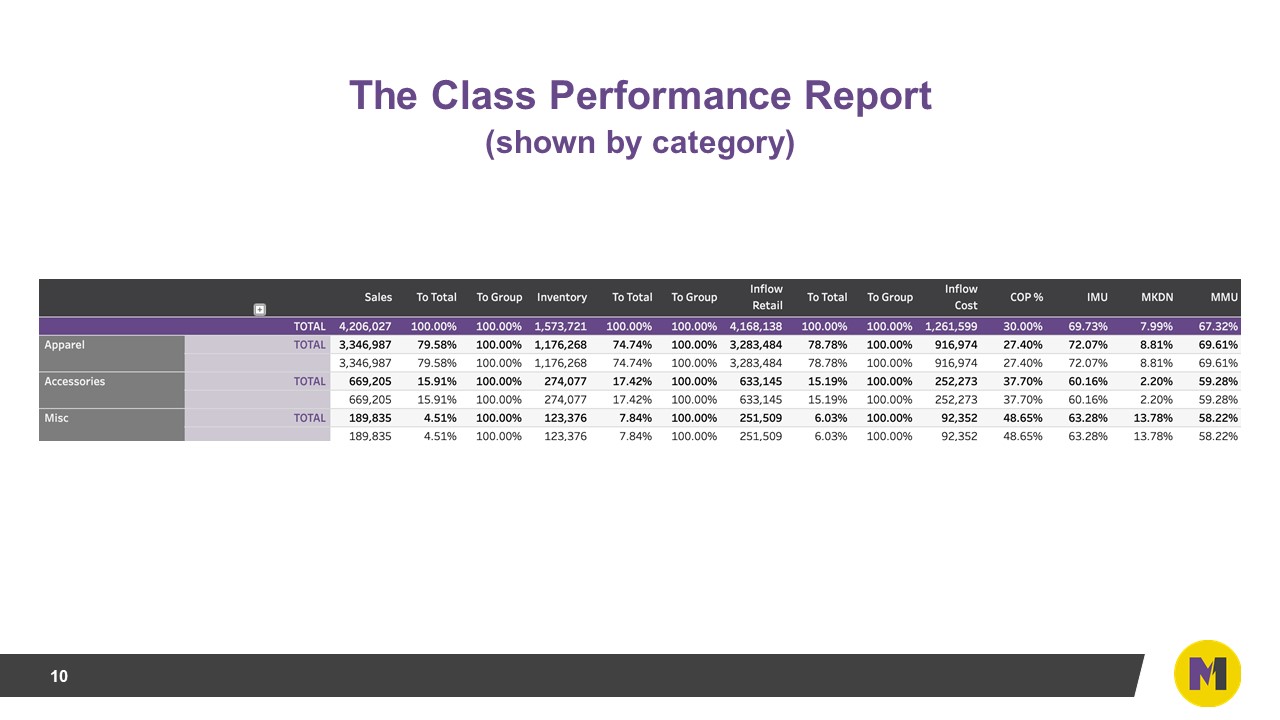
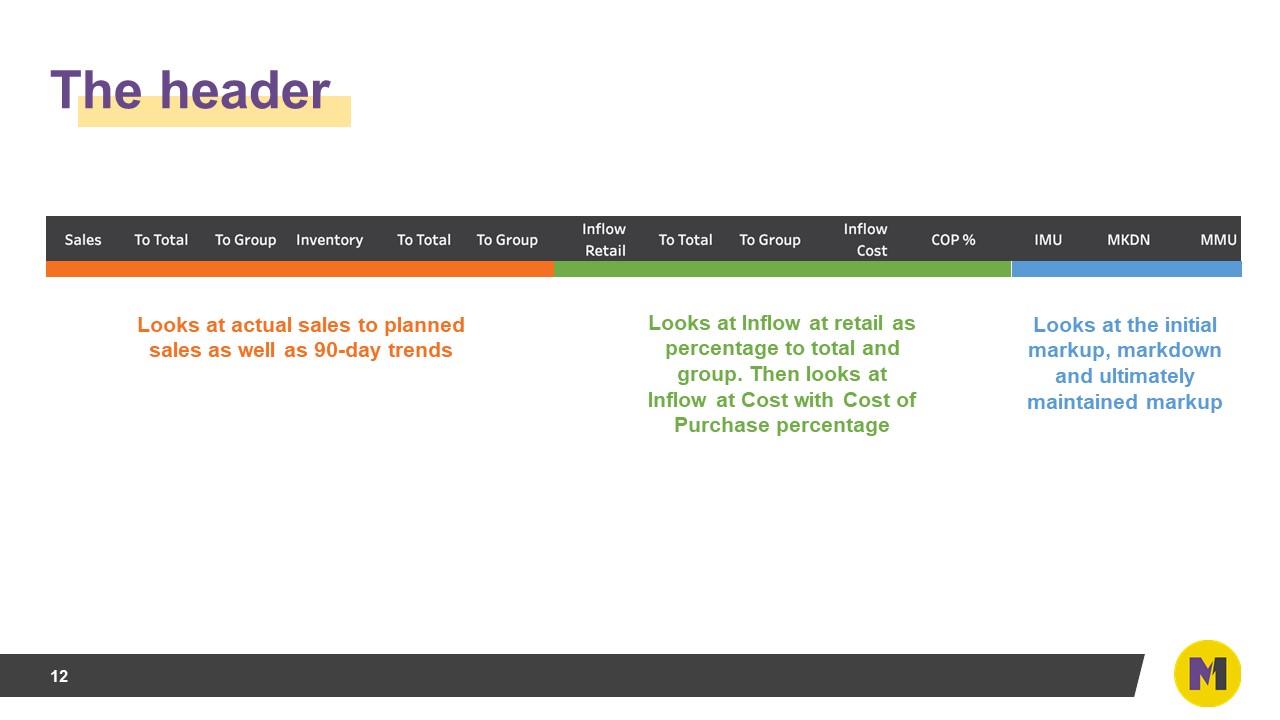
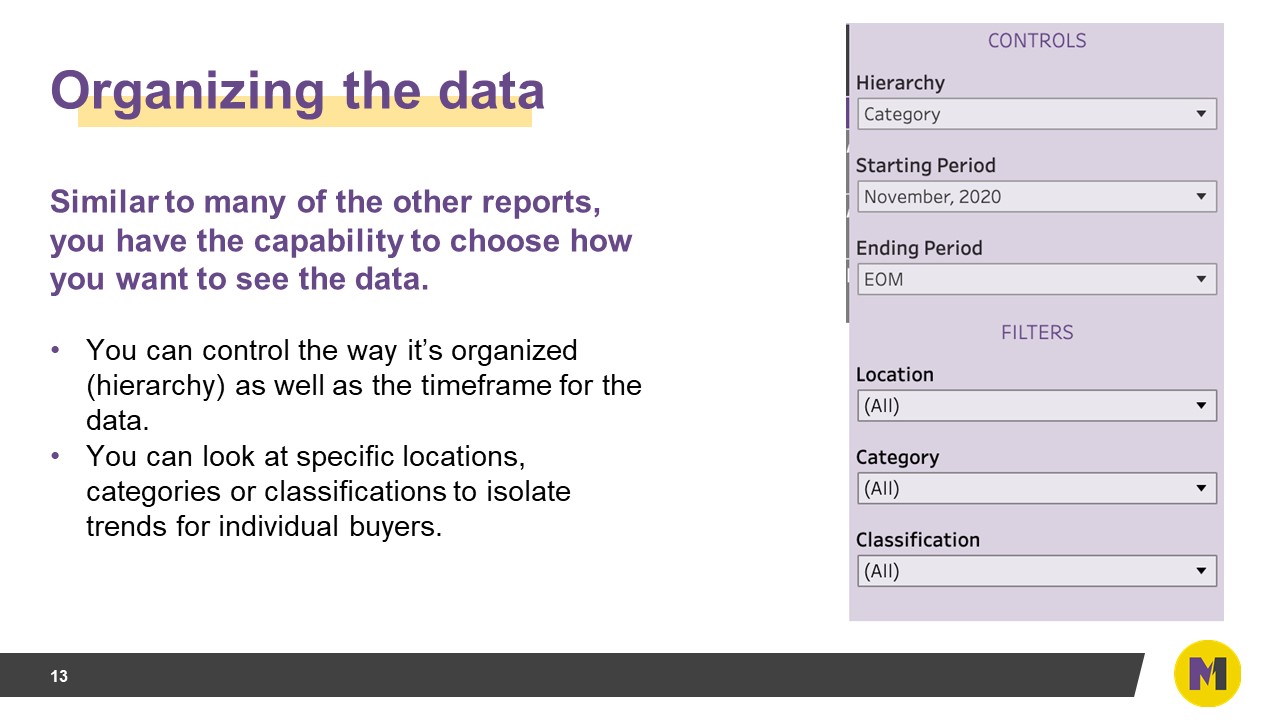
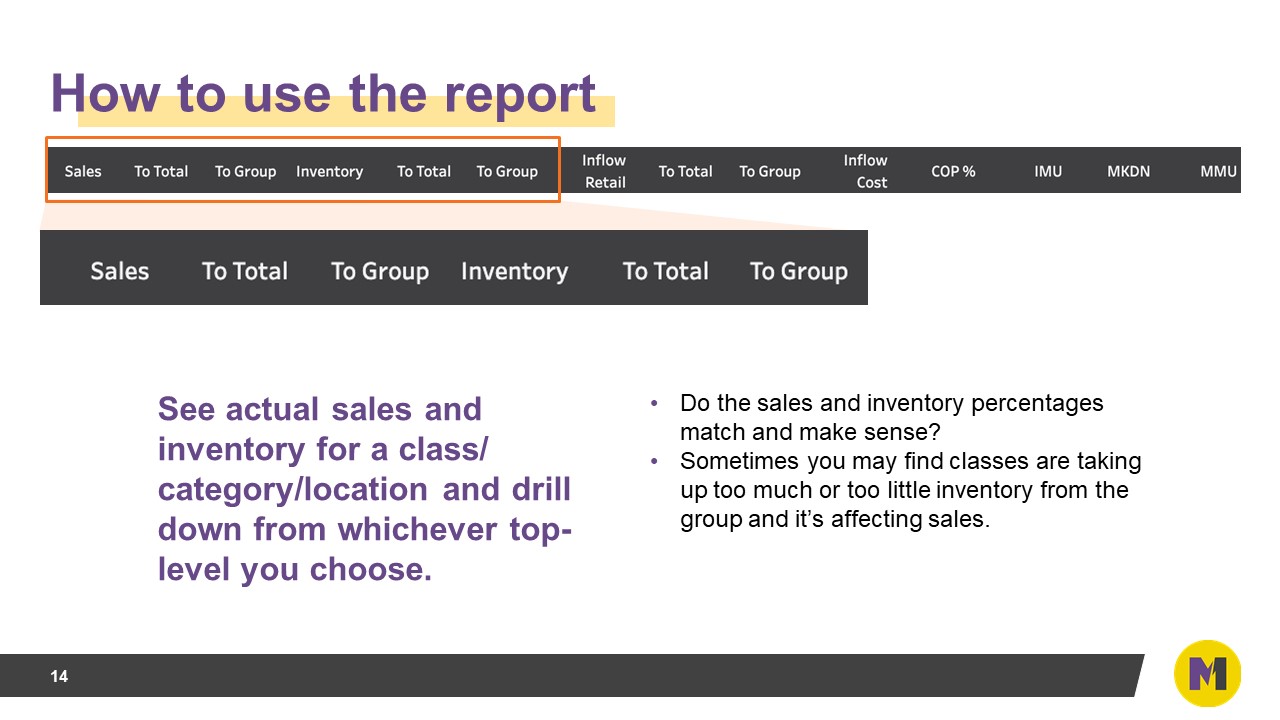
Inspecting any of these metrics, you can organize them better with new interactive features that enable you to sort and trend any of the class performance metrics.
Span: This creates more flexibility to show trends in the inflow and margin metrics and how that could be influencing recent seasonal trends.
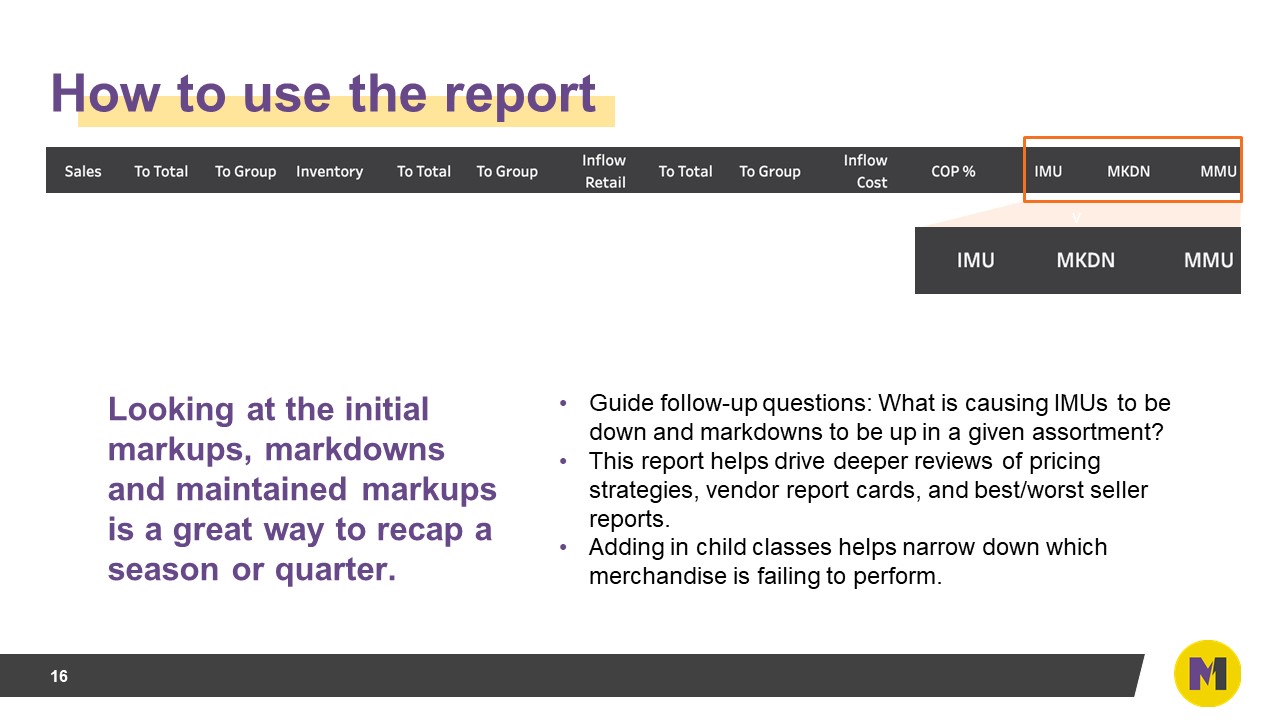
- Are there classes where I am getting better or worse margins this month based on what has changed with IMU?
- What were my sales relative to inventory last month? What were sales relative to inventory over the last 3,6,12 months, for example.
- Is there a change in the balance and flow over these different time periods? Suppose we are in the middle of fall season, and I want to know if the balance of my inflow and inventory is creating enough sales for a class like sweaters.
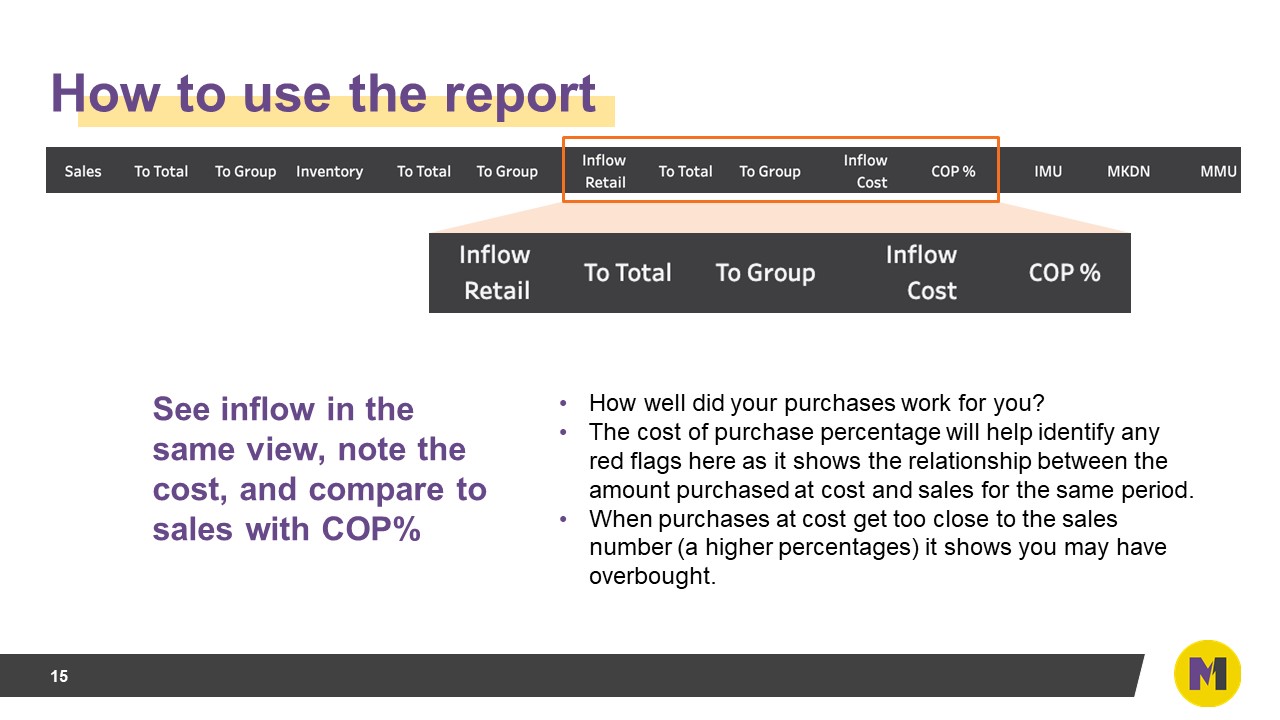
- Is there an important trend in the cost of purchases by class? This is an important metric that can show where there may be a notable correlation between inflow and revenue, which could affect cash, and can even suggest which classes could be vulnerable to slouching sales due to lack of fresh merchandise. Or those that are recently fresh on site and need to drive sales. Let’s see how all of this can be done with span.
Focus on the Denim class in the video below: the inventory appears to be selling down through markdowns, and not by new goods. Cost of Purchases went from 65% 6 months ago to 17% over the last 2 months.

Comments
0 comments
Please sign in to leave a comment.